Threat Intelligence Exchange workflow with the NTP option enabled
Technical Articles ID:
KB95179
Last Modified: 2022-01-18 14:49:22 Etc/GMT
Summary
Network Time Protocol (NTP)
NTP is an Internet Protocol that's used to synchronize the clocks on computer networks. It synchronizes clocks within a few milliseconds of the universal coordinated time (UTC).
Background Details:
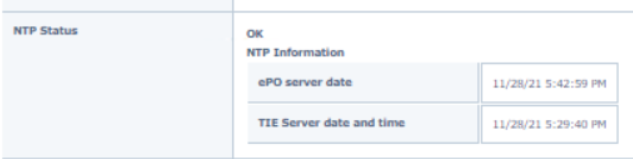
- An option to check the NTP status is available on the TIE Server when you deploy the TIE ISO or an OVA file.
- To locate the option:
- Log on to the ePO console.
- Go to Server Settings, TIE Topology.
- Click Edit.
Failures
When the NTP check fails, you see an error similar to the following displayed in the Server Settings, TIE Topology page:
NTP service is experiencing synchronization issues.
- Make sure NTP servers have been configured on the appliance.
- Run /user/sbin/reconfig-ntp in the appliance.
- More information can be found here KB90548.
NOTES:
- The NTP check is validated every time the TIE Topology page loads.
- When the NTP check fails, you see the core error below in red on the TIE Topology page:
Unable to connect DXL
Workflow to check for the NTP failure:
Enable Debug Logging:
Debug logging must be enabled through the TIE policy:
- Log on to the ePO console.
- Open the Policy Catalog.
- Click Threat Intelligence Exchange Server, TIE Server Settings, Server Configuration.
- Set the Log Level to Debug.
TIESERVER.log ( /var/McAfee/tieserver/logs)
Example
DETAIL {2021-07-13 05:01:56,396} [DxlServiceRequest-default-thread-35] (JsonUtil.java:95) - traceId: {4cad2e2a-44db-4bd8-a70e-a4717cd1a807} - request: /mcafee/service/tie/management/health : {"level":"SLA"}
DETAIL {2021-07-13 05:01:56,546} [DxlServiceRequest-default-thread-35] (JsonUtil.java:95) - traceId: {4cad2e2a-44db-4bd8-a70e-a4717cd1a807} - response: /mcafee/service/tie/management/health :
{"health":{"status":"ERROR","checks":[{"status":"OK","type":"database_status","data":{"availableSpaceInData":97137623040,"availableSpaceInRoot":1547231232,"currentDatabaseSize":786349191,"biggestTableSize":161538048,"
replicationWindowSize":8589934592,"maximumConnections":1024,"remoteConnections":0,"localConnections":110,"replicationConnections":0,"shouldVacuum":true,"shouldReindex":true,"isPrimary":true,"isServiceRunning":true
,"isLocalDataBaseEnabled":true,"latestVacuumDate":"1626116419000","latestVacuumFullDate":"1625949078000","latestReindexDate":"1625949109000"}},{"status":"OK","type":"apihealth",
"data":{"overallRate":0.15493194194731671,"cpu":1,"queueSizes":{"DEFAULT":0},"queueUsagePercentage":{"DEFAULT":0.0}}},{"status":"ERROR","type":"gti_connectivity",
"data":{"CERTIFICATE":{"lastCommTime":1626152460503,"lastCallSuccess":false,"requestsCount":22946998,"responseTime":0,"rollingAverageResponseTime":0,"internalGtiStatus":"ERROR",
"tieApplianceUptime":1625068380,"clientEnabled":true,"clientInitialized":true}}},{"status":"OK","type":"ntp_status","data":{"ntpStatus":"just_synchronised","serverDate":"1626152054000",
"ntpOffset":300000.0,"lagging":true,"synchronised":true}},{"status":"OK","type":"certificates","data":{"matchingCn":true,"matchingCa":true,"atdKeystoreValid":true}}]}}
NOTES:
- The ntpstatus has three possible results:
- just_synchronised
- Unsynchronised
- Synchronised
- The file ntp-health.sh is stored in /usr/sbin/ folder.
Condition A - If the NTP connection is good:
It shows as synchronized, Lagging as false, and the offset is less time, which confirms no latency.
-bash-4.1# ntp-health.sh
Output
{
"ntpStatus": "synchronised",
"ntpOffset": 0.630,
"ntpIsLagging": false,
"serverDate": "07-14-2021 06:06:23"
}
Condition B - If there’s a latency or a lag to each the NTP server:
In this state, you see just_synchronised or unsynchronized.
-bash-4.1# ntp-health.sh
Output
{
"ntpStatus": "just_synchronised",
"ntpOffset": 300000,
"ntpIsLagging": true,
"serverDate": "07-14-2021 07:59:47"
}
-bash-4.1# ntp-health.sh
Output
{
"ntpStatus": "unsynchronised",
"ntpOffset": 300000,
"ntpIsLagging": true,
"serverDate": "11-28-2021 12:14:22"
}
Analyzing the results
- In this state, NSP still works until the lagging is false, and offset must be a low value.
- To test, run ntp-health.sh multiple times every few seconds. This action shows the health and reachability to NTP server from the TIE Server.
NOTES:
- The health check to the NTP server uses two commands (ntpstat and ntpdate). If the ntpstat fails to get a response, it uses ntpdate.
- If the connection is established through the ntpstat, it shows synchronized.
- Íf the connection is established through the ntpdate, it shows just_synchronised.
The NTP Status strings explained:
- When the ntpstat states in sync:
Status: "synchronised"
- When the ntpstat states not in sync, couldn't sync with any of the servers:
Status: "unsynchronised"
- NTP isn’t running:
Status: "stopped"
- Able to sync with a server using ntpdate:
Status: "just_synchronised"
- No valid servers configured to use NTP:
Status: "no_servers"
Useful commands to check the status of NTP server connectivity and latency:
-bash-4.1# ntpstat
Output:
synchronized to NTP server (10.1.1.10) at stratum 3
time correct to within 142 ms
polling server every 1024 s
-bash-4.1# ntpstat
Output:
unsynchronised
polling server every 8 s
How to restart and check the status/ of the NTP service:
-bash-4.1# /etc/init.d/ntpd status
ntpd (pid 27661) is running...
-bash-4.1# /etc/init.d/ntpd restart
Output
Shutting down ntpd: [ OK ]
Starting ntpd: [ OK ]
-bash-4.1# /etc/init.d/ntpd status
Output
ntpd (pid 28463) is running
|


")