After the successful deployment and initial configuration of Trellix EDR, you'll want to test whether the product is functioning correctly. To test, trigger a dummy endpoint detection and verify whether the alert is accurately shown in the Trellix EDR workspace.
Steps to perform in a Mac Operating System:
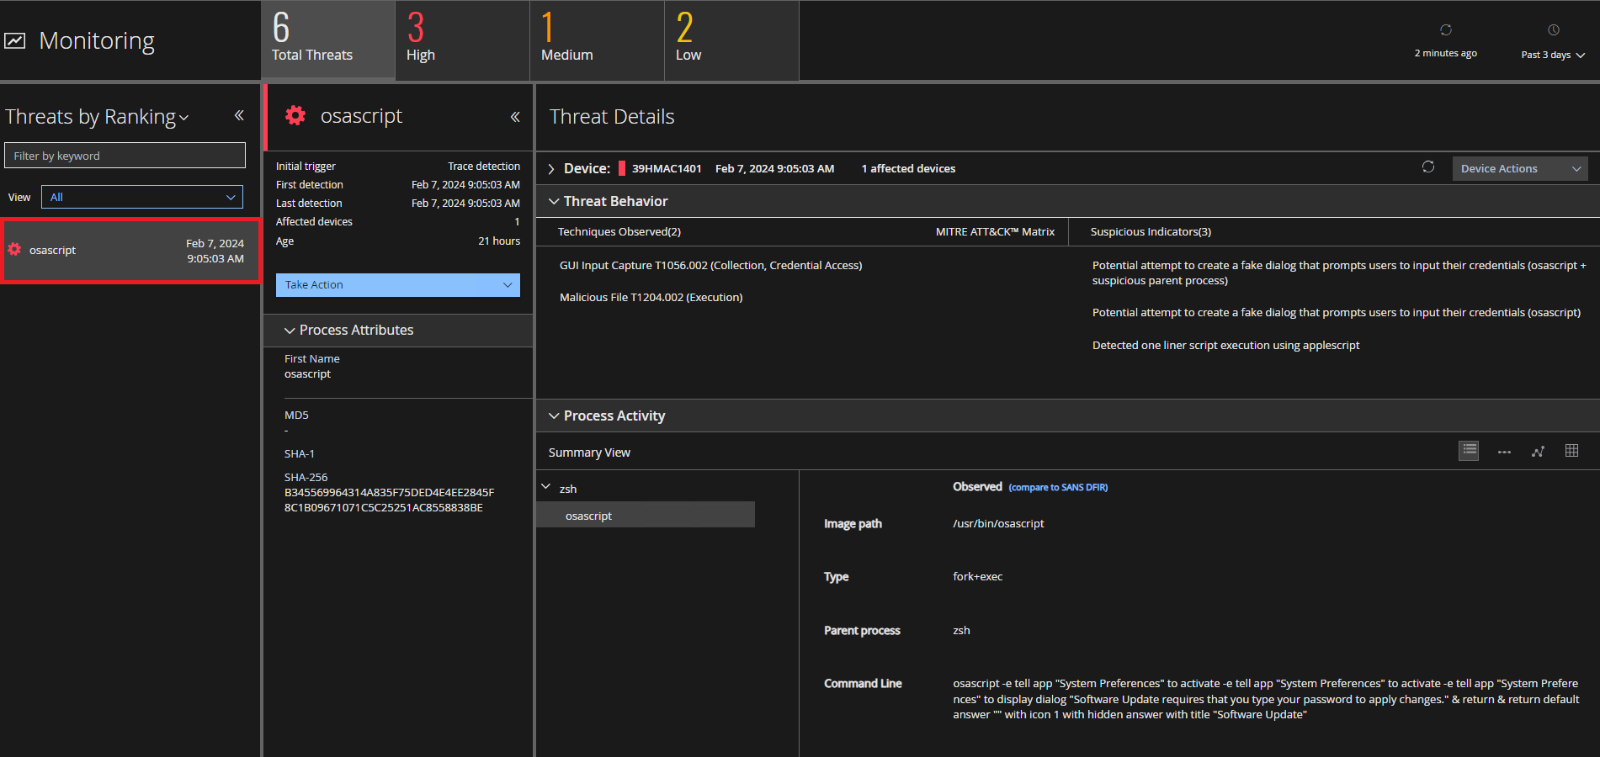
This script mimics a credential steal attack. It disguises itself as a System Preferences process requesting the user's password. In this case, the user's input is discarded so there's no threat to the system.
Mitre technique observed: https://attack.mitre.org/techniques/T1056/002/
NOTE: The permissions from Step 4 below can be removed from
System Preferences,
Security & Privacy,
Automation.
- Download and unzip the sample-MacOS-threat.zip file attached to this article.
- Copy the command found in the unzipped threat_sample_macos.txt file.
- Paste the command in Terminal and press Enter to run it.
- The script will open System Preferences.
If a pop-up shows on the screen requesting permissions for System Preferences, click Allow.
- Another window will open with a text input field. Click OK.
- Wait for the Trace detection to process and display in the Monitoring Dashboard of the Trellix EDR workspace.
The result looks similar to the following image. Note the section highlighted in red.
Steps to perform in Windows Operating System:
You can verify that the Trellix EDR client is correctly generating Trace detections. Use
PowerShell to execute an encoded command that creates and then deletes a dummy registry value in:
HKCU\Software\Microsoft\Windows NT\CurrentVersion\Image File Execution Options
- Press Windows+R, type cmd, and press Enter.
- Download and unzip the sample Windows threat.zip file attached to this article.
- Copy the command in the unzipped file and paste it into the command prompt window.
Then, press Enter and wait for the command prompt window to exit.
- Navigate to the Monitoring tab of the Trellix EDR workspace.
- Wait for the trace detection to process and display in the EDR workspace.
The result looks similar to the following image. Note the section highlighted in red.
.png)
Steps to perform in a Linux operating system:
- Download the sample Linux threat.zip file attached to this article and copy it to the Linux host.
- Extract the archive. The extracted file is php-fpm.
- Open a command-line session, and navigate to the folder containing php-fpm.
- Provide full file access:
Type chmod 777 php-fpm and press Enter.
- Run the executable:
Type ./php-fpm and press Enter.
- Wait for the Trace detection to process and display in the Monitoring Dashboard of the Trellix EDR workspace.
The result looks similar to the following image. Note the section highlighted in red.


")


