Using Protection Workspace to identify and remediate threats
The Protection Workspace provides a visual representation of threat incidents in your environment and device compliance data, all from a single dashboard. You can quickly identify threats detected in the environment and seamlessly navigate to any impacted device to remediate the threat.
The Protection Workspace is made up of several parts where you can view and react to threats:
- Threat Overview — View threat information across multiple categories. To track devices that have encountered multiple threats and might require attention, view the number of escalated devices. Devices are escalated automatically, based on the severity of the threats impacting the system. To see a more detailed view of the categories, select any value.
- Compliance Overview — View the status of security content and the individual products deployed in the environment. Devices are color-coded to indicate their security status (health). You can easily identify the systems that are up-to-date, or require an update or product deployment.
- Devices View — View your devices by tags (default), as System Tree, or as a list. Use the search feature to quickly find a device. The Devices view changes depending on the device summary you select. If you select Escalations, the pane displays all escalated devices.
Navigating the Protection Workspace
The Protection Workspace is where you can see all potential threats on managed devices and respond to them.
The Protection Workspace helps you answer these questions:
- What are discovered by advanced threat protection technologies from products such as the following:
- Endpoint Protection Platform?
- Real Protect?
- Endpoint Protection Platform Security ATP?
- Why is a device escalated?
- Where did the threat come from?
- When was the threat discovered?
Identifying threats
Colors in the Protection Workspace represent the type of threat discovered:
Red — A threat was discovered, or your software or devices are running outdated versions and must be updated to be compliant.
Orange — There are threats to investigate or some devices aren't up to date.
Green — The current state of your environment is healthy, threats have been mitigated, and devices are compliant.
Gray — No data available.
Investigating threats
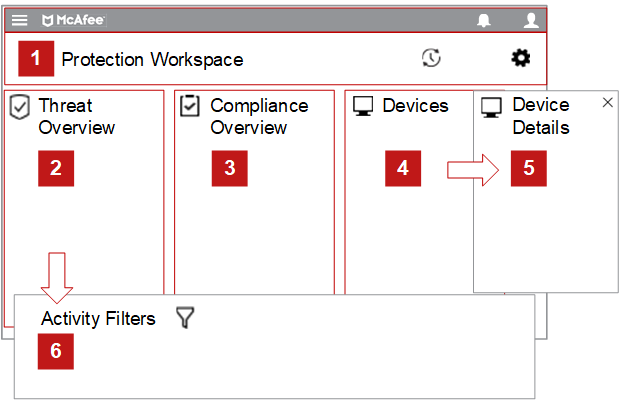
The Protection Workspace is divided into several categories. These categories allow you to view compliance information and manage key threats in one place. When you interact with the Protection Workspace, start on the left side and progress to the right.

- View the total number of devices tracked by the ePO server, and the total number of devices that are tagged as escalated.
- View threat information across multiple categories. When you view the number of escalated devices, you can track the devices that have encountered multiple threats and might require attention. Devices are escalated automatically based on the severity of the threats impacting the system. To see a more detailed view of the categories, select any value.
- View the status of security content and the individual products deployed in the environment. Devices are color-coded to indicate the security status (health) of the device. You can easily identify the systems that are up-to-date, or require an update or product deployment.
- View your devices by tags (default), as System Tree, or as a list. Use the search feature to quickly find a device. The Devices view changes depending on the device summary you select. If you selected Escalations, the pane displays all escalated devices.
- Drill down to view the device details and the top five threats.
- Drill down to filter and view your threat activity. For example, you can filter by device, threat, or originating process.
Getting started with the Protection Workspace
The Protection Workspace is divided into several categories that allow you to view compliance information and manage key threats in one place. When you interact with the Protection Workspace, start on the left side and progress to the right.
| Name |
Category |
Description |
Protection
Workspace bar |
Devices |
Total number of devices tracked by the ePO server. |
| Escalations |
Total number of devices that are tagged as escalated. Select a device and view Escalated Devices. A system is escalated if it detects 5 threats or more in 24 hours. |
| Update |
Updates automatically occur every 5 minutes. Click the refresh icon to manually redisplay the Protection Workspace. |
| Settings |
Use the Protection Workspace settings to do the following:
- Change the interface to High Contrast Mode
- To customize the security levels for your environment, adjust the Security Content Color Thresholds and check-In Failure Color Thresholds
|
| Threat Overview |
Escalated Devices |
Total number of devices that received a threat over the past 7 days. A system is escalated if it detects 5 threats or more in 24 hours. |
| Resolved Threats |
Total number of threats that were resolved in the past 7 days.
- Basic — Detected by products like VirusScan Enterprise, Endpoint Security Threat Prevention, and Microsoft Windows Defender.
- Advanced — Detected by advanced detection techniques like Endpoint Protection Platform, Real Protect, and Endpoint Security Adaptive Threat Protection (ATP).
|
| Unresolved Threats |
Total number and count per day of detected threats that are unresolved. The arrow indicates the trend over the past 7 days. |
| Data Protection |
Reports only the total number of Data Loss Prevention and Management of Native Encryption events over the past 7 days. |
Compliance
Overview |
Security Content
NOTE: You must have the product extensions installed to see the categories. |
Percentage of systems that are within a specific number of days using a current DAT. For example, If the DAT is within 3 days of release, it's considered compliant. If it's older than 3 days, it's noncompliant. |
| Software Status |
Status of the security content and the individual products deployed in the environment. For example, McAfee Agent, Endpoint Protection Platform, and Microsoft Windows Defender.
The devices are color-coded to indicate the health of the security status of the device:
- Green — Latest (most recent) version.
- Orange — One or more versions behind.
- Light gray — No data available. The extension is checked in to ePO, but the product hasn't been deployed.
- Dark gray — The extension is checked in, but the product isn't installed on the endpoint.
|
| Device Management Status |
Check-in Failure indicates the number of devices that haven't been checked in to the ePO server for more than 15 days.
Managed Devices without Protection indicates the number of devices that don't have these antimalware products installed:
- Threat Prevention
- Endpoint Protection Platform
- VirusScan Enterprise
Managed Devices indicates the total number of managed devices over the past 7 days. |
| Devices |
|
View your devices by tags in the System Tree, which is the default, or as a list.
Use the search feature to quickly find a device.
The information that appears in the Devices pane changes depending on the category you select:
- Devices
- Escalated Devices
Drill down to view the device details and the top 5 threats. Select any threat to open the Threat Details pane, and view specific details about a specific threat. |
Threat Event workflow example
The Protection Workspace provides a snapshot of your network's security status. This allows you to view key threats so you can investigate and determine a response.
- The Protection Workspace shows key threat events and compliance across Trellix products.
- The security administrator quickly evaluates urgent events and escalated devices.
- The security team investigates the escalated devices to determine a response.
Apply Protection Workspace tags to systems
Tag devices (systems) to escalate or exclude them from a compliance check.
Task
- In the Protection Workspace, select a device from the tag, tree, or list view. The Device Details pane opens.
- From the Security State drop-down list, select a tag.
- Click Confirm.
 Loading...


