This article describes several options for monitoring your TIE Server deployment.
NOTE: As of TIE Server version 2.1.0, the naming convention for Master and Slave operations changed to Primary and Secondary. For example:
Master becomes Primary
Slave becomes Secondary
Previous versions of TIE Server retain the original Master/Slave designations.
ePolicy Orchestrator (ePO) - Automatic Responses of TIE Server Health
TIE Server enables you to use ePO server events to create ePO Automatic Responses, including email notifications, among other possible actions.
An ePO server task named
TIE Server Monitoring runs hourly. It creates events if TIE Server instances aren't reachable or if their health API doesn't respond. You must create matching ePO Automatic Responses to act when the events are received. The generated event ID range is 37175–37179. Each ID matches a given TIE Server operation mode for better troubleshooting. Create the Automatic Responses under
Menu,
Automatic Responses,
New Response. Set the
Event type to
Server, filter with the
Event ID being
Equal to the TIE Server range
37175–37179, and choose the
Send Email Action.
NOTE: An email account must be configured under Menu, Server Settings, Email Server to receive emails for Automatic Responses.
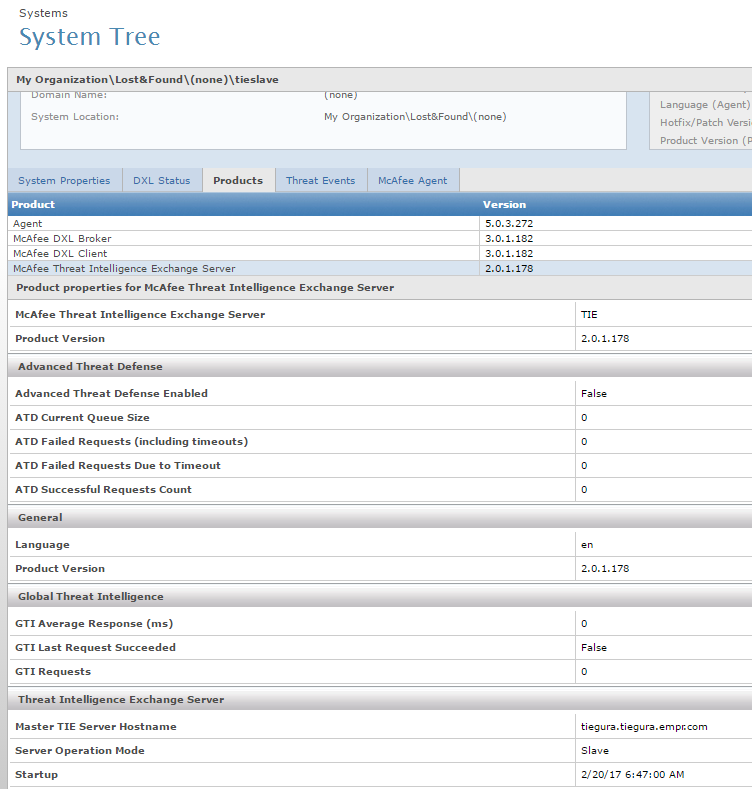
ePO - Product Information at the Device Tree:
ePO provides customized product properties for TIE that include relevant metrics on Advanced Threat Defense (ATD) and Global Threat Intelligence (GTI) integrations.
Located under
System Tree,
TIE Server Appliance's System Name,
Products,
McAfee Threat Intelligence Exchange Server.
The screenshot below shows a sample output:
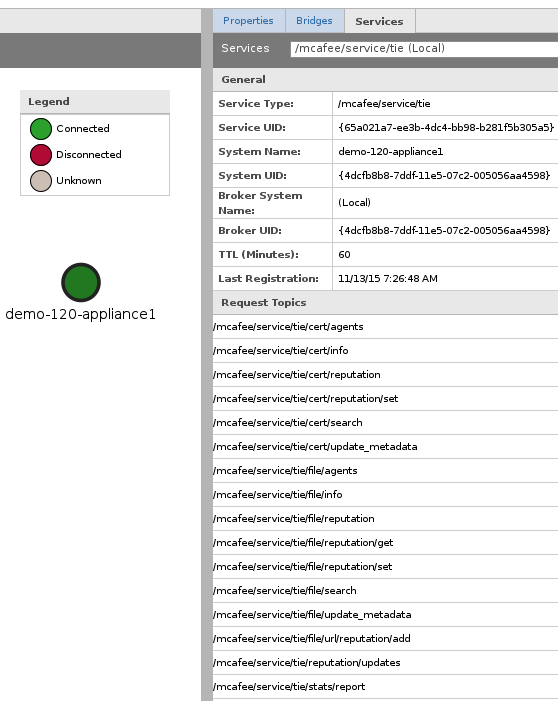
ePO - Data Exchange Layer (DXL) Fabric Topology Page:
This page has been available since DXL 1.1 at Menu, Configuration, Server Settings, DXL Topology. The DXL Fabric Topology page displays information about DXL properties, bridges, and services. Each DXL Broker also shows the number of messages per second handled by the DXL services. The following screenshot shows sample output registration information for the TIE service:
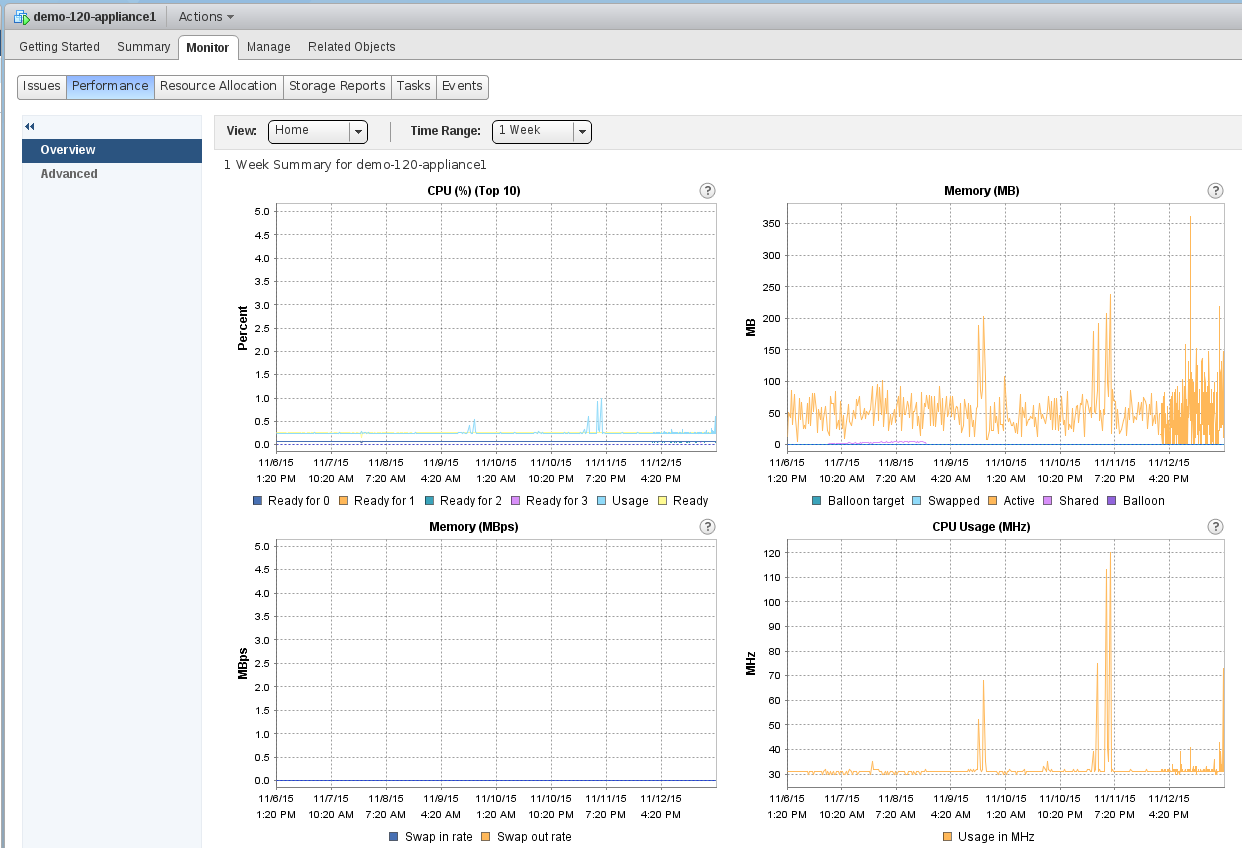
VMware Performance Monitoring:
The TIE Server virtual appliance runs over
VMware technology, which provides monitoring and alerting capabilities at the host level. For more details, see the "vSphere Monitoring and Performance" section of the
VMware documentation for your version. The following screenshot shows a sample output of the performance of a TIE Server instance:
ePO Web APIs:
DXL Broker offers ePO Web APIs to report the number of connected clients. Any monitoring solution can reuse the ePO Web APIs to monitor services and their health over time to identify issues. The following monitoring remote commands are available since DXL 2.0:
- dxl.broker.queryRegisteredServices: Returns a list of DXL Registered Services
- dxl.client.fabricHeath.fabricHealthCommand: Retrieves DXL Broker health information
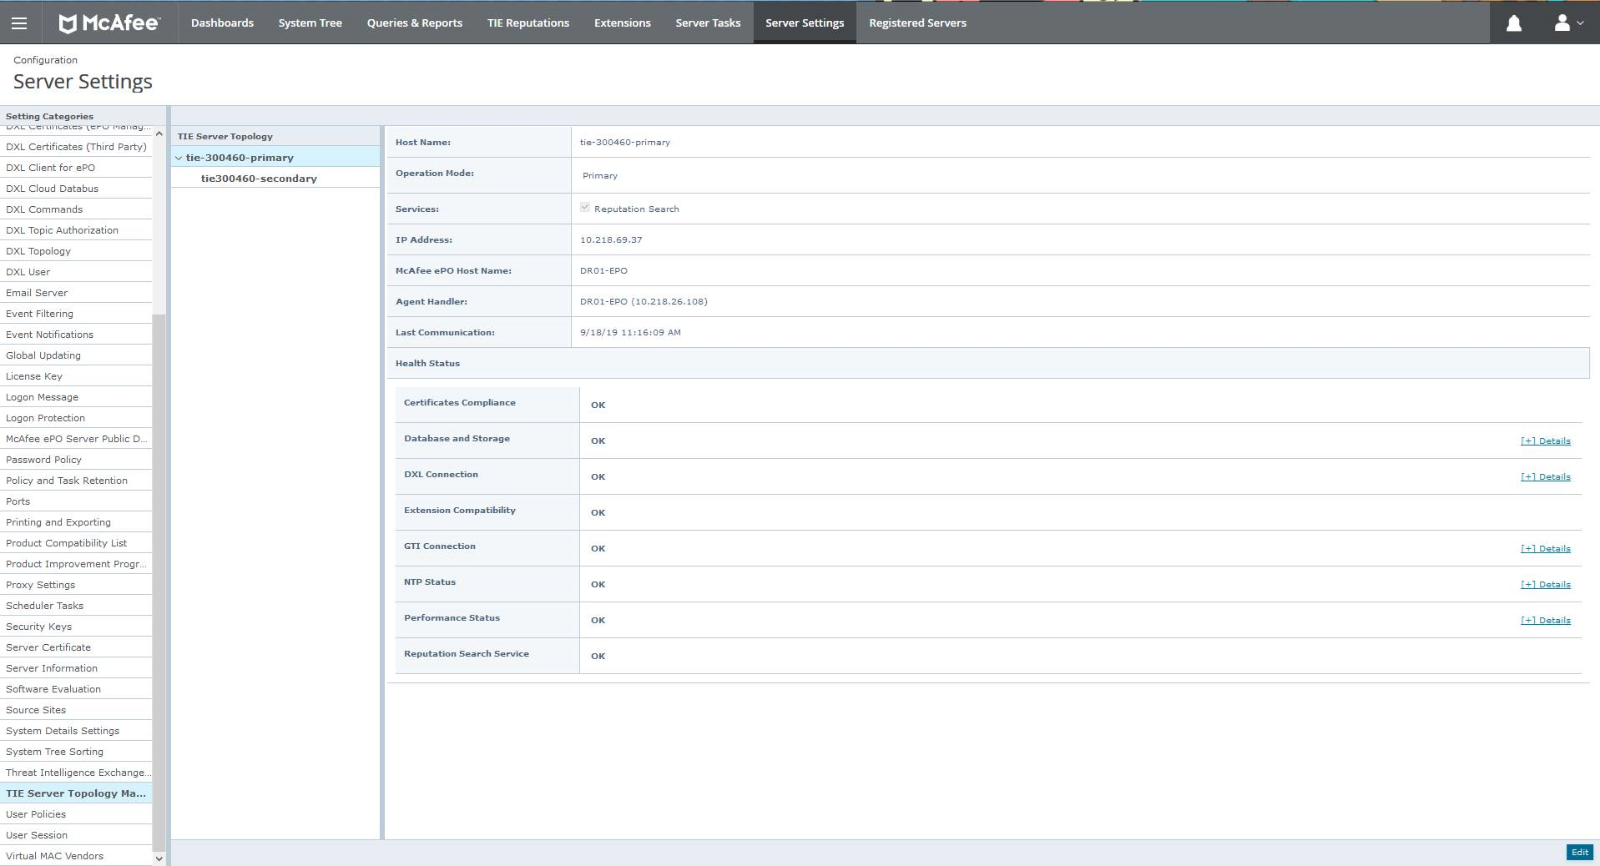
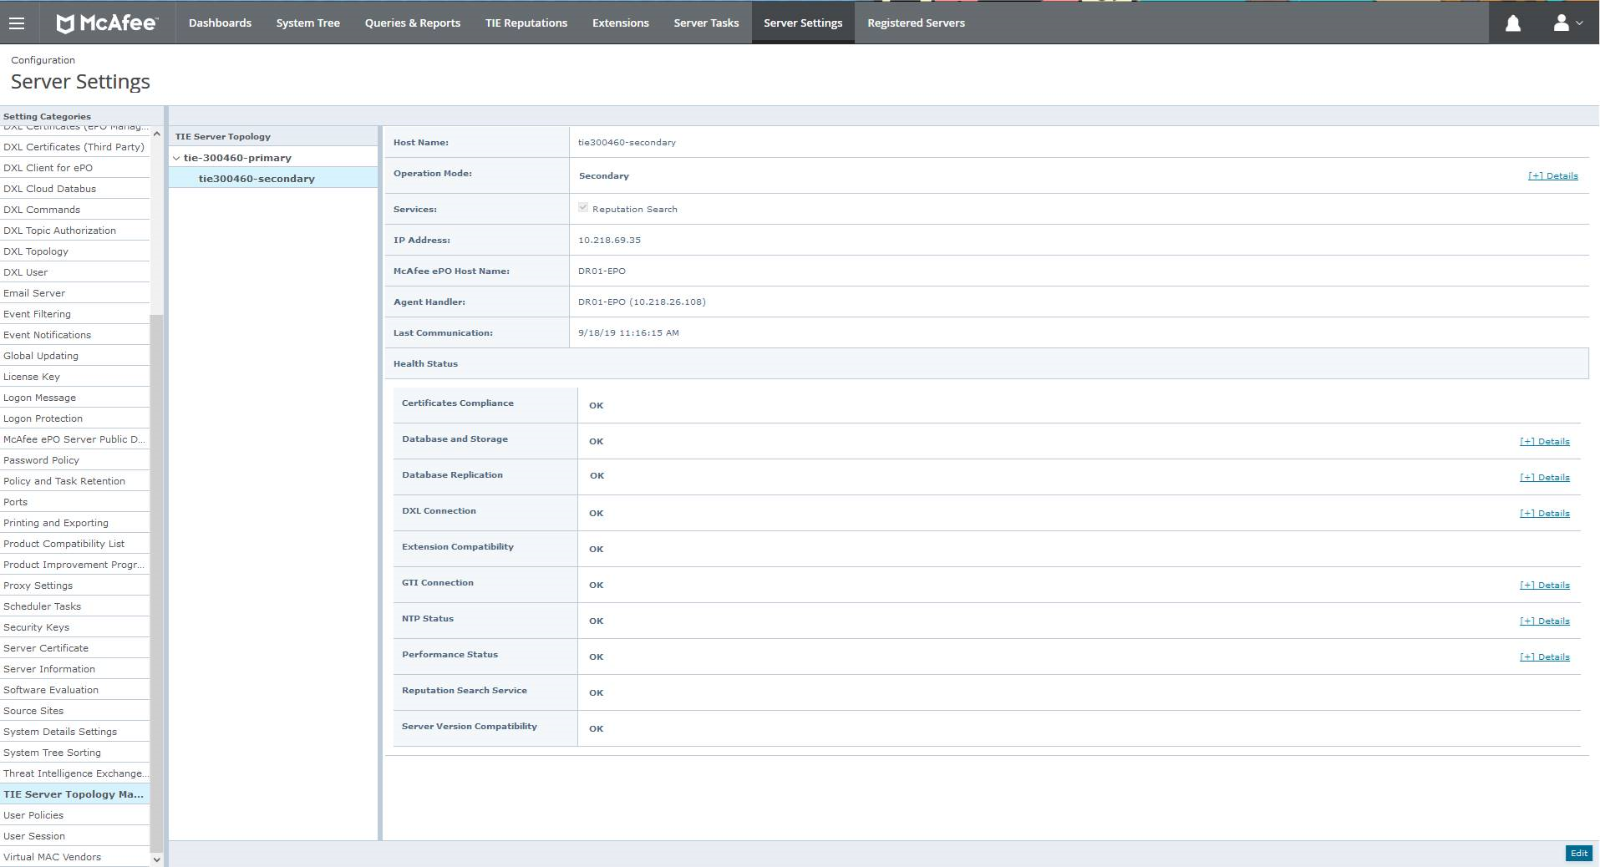
Health Status Feature
The overall Health Status for each server can be found on the
TIE Server Topology Page. Navigate to
Menu,
Configuration,
Server Settings, and select the "TIE Server Topology Management" section. Here, you can review the DXL, ATD, and GTI connectivity status of each TIE Server instance. You can also see if the database versions within each TIE Server are compatible, and whether the extension version installed and the Server extension version match. There are also sections that describe the performance status, NTP status, Database and storage, and Certificates compliance. For the secondary servers, you can review the Database Replication status as well.
Example:
TIE Health Status - Primary Server
TIE Health Status - Secondary Server
 SAR Feature
Starting with TIE Server 2.0.0, the
sysstat package is installed on the appliance, making the
sar command available.
The MER tool copies all
sar logs to
logs/sys/sar. With a local copy of the
sar command, or the
sadf, several queries can be performed using these files. To simplify, a
logs/sys/sar/ksar.txt file is generated using the
ksar tool.